Google Analytics is a powerful tool in helping you understand what people are accessing on your website. It can help drive the content and strategy for your website and overall marketing when you know exactly what the consumer wants. It can also point out flaws in a website if you notice users are never getting to the destination you want: conversion. But how the heck do you even access that data?? Google Analytics can be overwhelming, but following these few simple steps, you can accurately find the most relevant information for your site.
A Simple Walkthrough of Google Analytics
What does all this information on my dashboard mean?
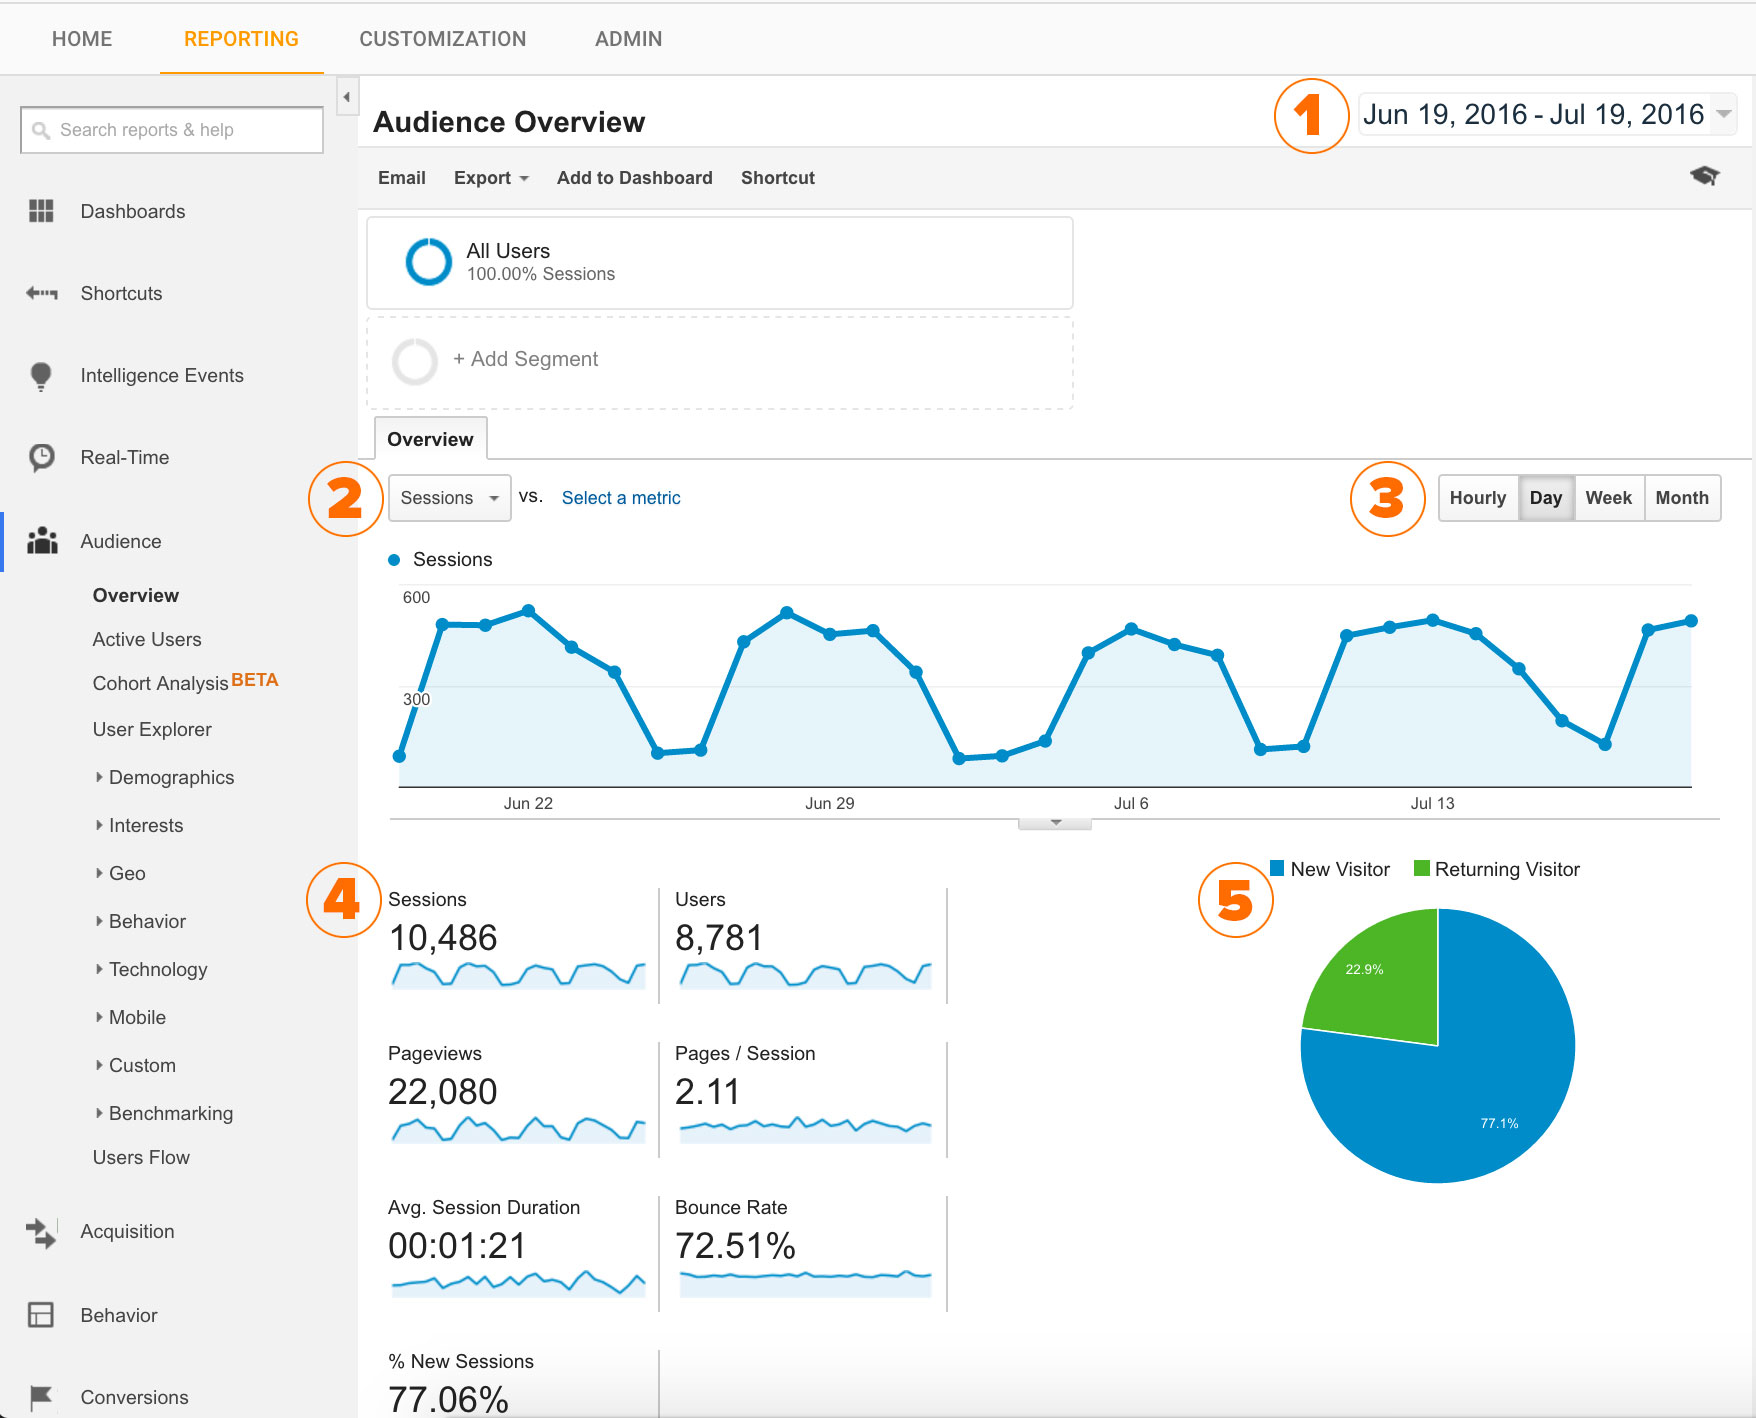
- Date Range – This is how you can control what shows up in the graphs below. The default setting is the last one month of data on your dashboard, but you can simply click on the date range and change it to as little or as much time as you’d like. This setting will carry out globally throughout all the data you query. There is a neat little setting in the date range too that says “compare to previous period” which allows you to compare the reports you’re running (for a week, a month, a quarter) to the previous segment of that amount of time.
- Sessions drop down: Here, you can change the data that appears on your graph and in the numbers below from sessions to users, bounce rate, duration of use on your website, and other metrics. We will get into what all these mean later.
- The tabs above the graph allow you to change whether your metrics are displayed in hourly, daily, weekly or monthly totals.
- Here there is quite a bit of terminology I’d like to explain to you. Google (and other analytic tools) uses specific language to describe what is happening on your website:
- Session: “A session is defined by a group of interactions that take place on your website within a given time frame.” A session essentially means the actions a person takes while on your website in one use. A single session can have multiple social interaction, transactions or page views. A person can bounce around and do many different things on your website all in one session. A session times out after 30 minutes of inactivity or at midnight. A session is the default metric for Google and likely the most telling piece of information they offer.
- Users – The people that come to your website are called users. These people have had at least one session with your website. The number shown includes new and returning users.
- Pageviews – This is simply the number of pages users have visited on your website in all the sessions shown.
- Pages / Session – Indicates the average number of pages one person visits per session.
- Average Session Duration – How long a user is on your website on average before leaving or becoming inactive.
- Bounce Rate – Bounce rate is the percentage of single-page sessions meaning a user comes to your website and leaves without interacting in any way. A high bounce rate can be a good thing or a bad thing. If you only have one page on your website or you’re getting your user exactly where they need to be (i.e a blog article or a direct link from social media), a high bounce rate is okay. However, if your bounce rate is high and you’re not seeing many conversions or leads, it could be that your website doesn’t convey information properly, is confusing to navigate, or incorrect implementation of your Google Analytics tracking code. 41-55% is roughly an average and good bounce rate to have. If you’re scoring above a 75-80%, you should consider making site improvements.
- % of New Sessions is the percentage of sessions in the given date range that are first time visits.
5. A graphical representation of new vs. returning visitors.
What pages are people visiting on my website?
To run a report showcasing what pages a user visits most on your website, open your Google Analytics account and follow the following steps:
- Set the date range in the left hand corner for the range you’d like to run your report (I’ve checked as often as weekly as little as once a quarter – it’s your website, it’s your call!):
- On the left side navigation, click the “Behavior” tab, then click the drop down for “Site Content” and select “Landing Pages”.
-
Your dashboard will update to display something like this:
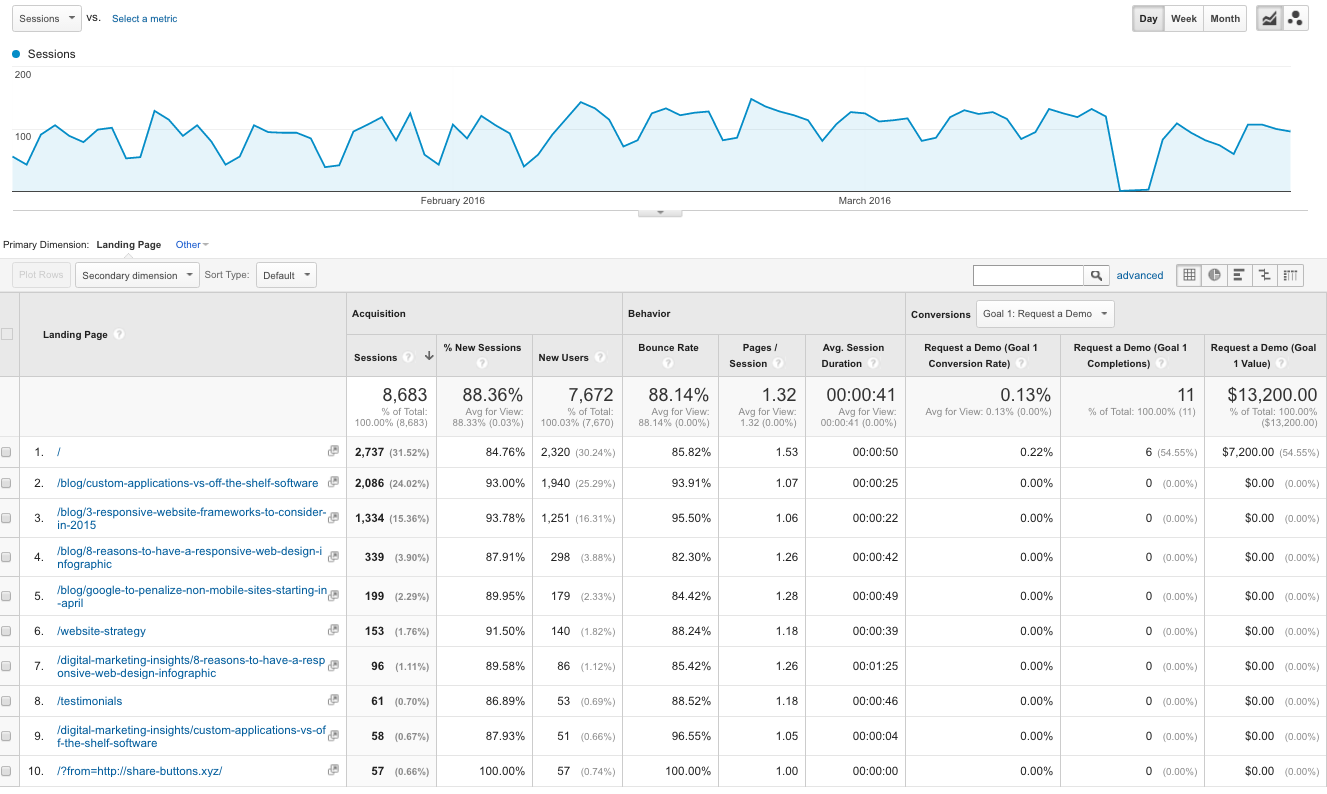
On the left side under Landing Page, you will see the URL’s of the most visited pages on your website. These landing pages will include pages like your home page and services, but it will also include your blog entries. From the example above, you can see that 6 of the top 10 pages visited on the website are blogs which is why blogging is so important to a content marketing strategy. Over 3,000 sessions occurred simply from writing on topics relevant to an industry.
- From here, if you’d like to view anything in a specific section of your website, like your store or your services, your can type into the search bar near the top right /section-name (ex: /store or /services) and the results will update to show all the pages within that section of your website.
Where are these users coming from?
To find the location where these users are coming from, follow these steps:
- On the left hand navigation, select audience, select the “Geo” drop down, and then choose location. You will get results like this:
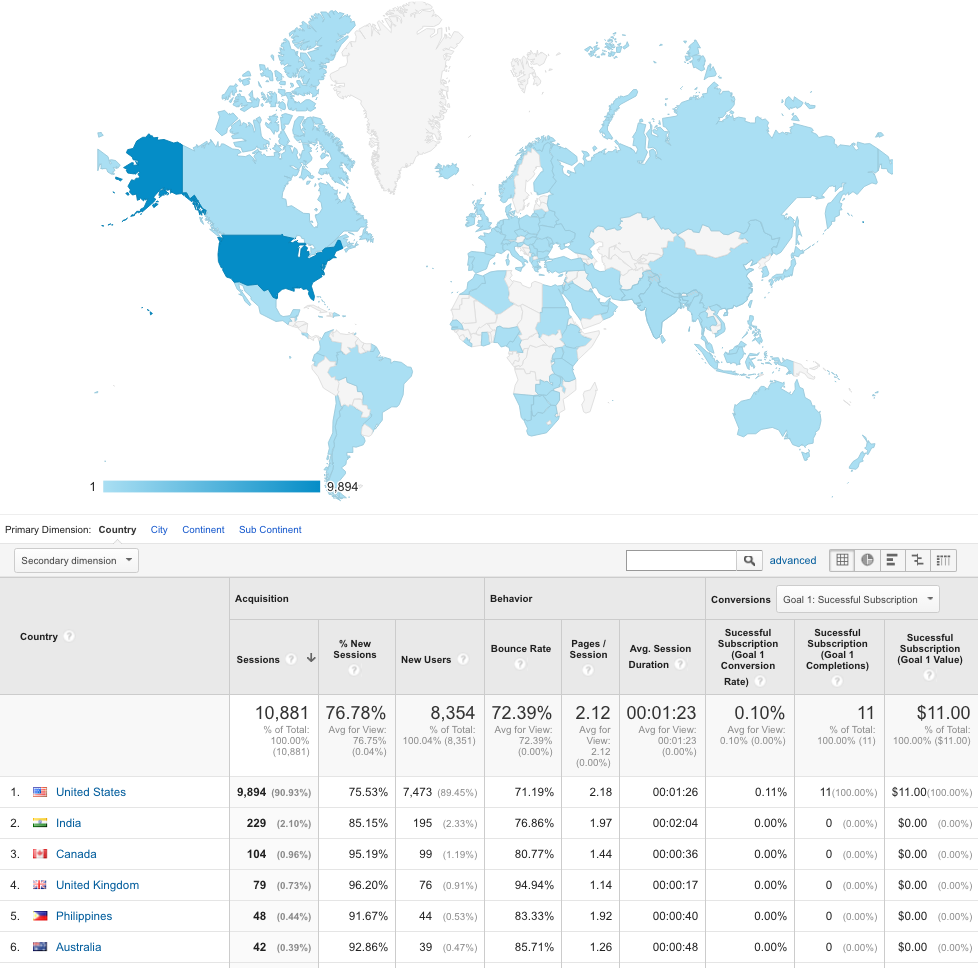
- The map is interactive, so feel free to click and zoom in as far as you’d like!
To find the source from which people are finding your website (social, paid advertisements, organic search, etc.) follow these steps:
- Click the Audience tab on the left side navigation, select “benchmarking” and then choose “channels”. You will get results that look like this:
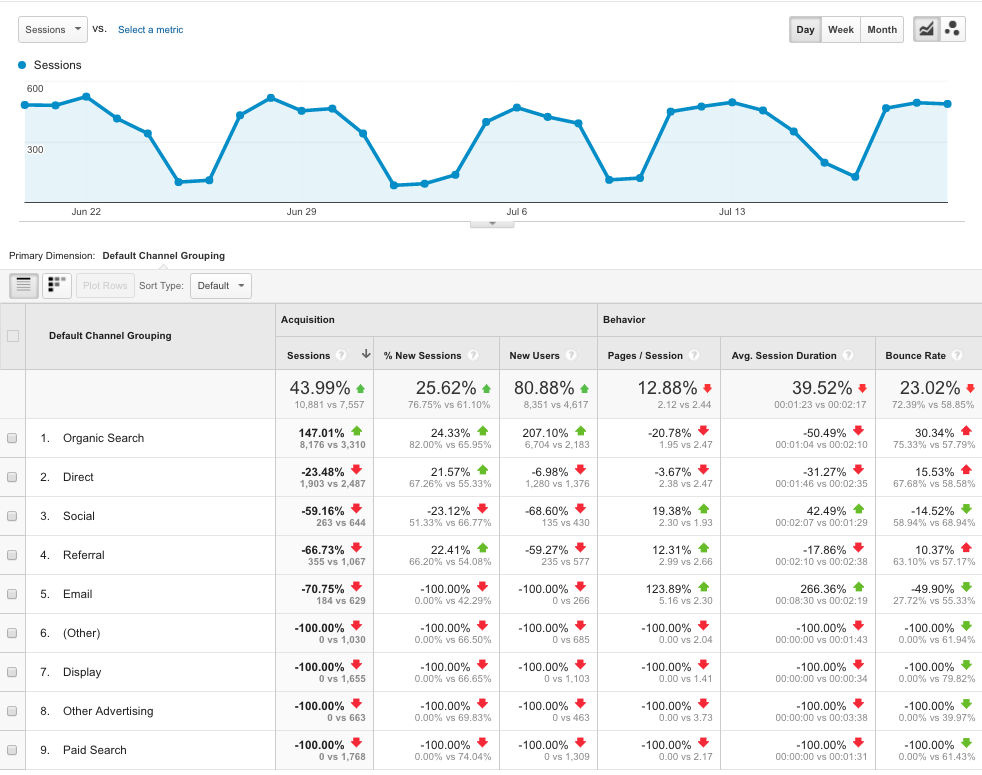
The ups and down are comparing your traffic to the previous period, and some will always be -100% because you do not use them (like paid advertisements). Organic search is the best form of traffic you can get because it’s free, and when the numbers are good, that means your website is showing up on Google to users for relevant content in your industry. Direct is simply someone typing in your URL, and social would showcase the users coming from Facebook, Twitter and other social channels.
What can I do with these numbers?
Now that you know what the numbers mean and the basics on what pages are being hit on your site, what do you do with all this information?
Here are a five simple tips and tricks:
- If your bounce rate is really high, consider improving the messaging, design or content on your website. A high bounce rate indicates people can’t find what they’re looking for or don’t find you credible. This would be the most important thing to fix!
- See what pages people are visiting. If most people are focusing on one of your services, start writing blogs on that topic or pushing people to that service through social media to increase leads. When you see the services people aren’t visiting, make the content better! If blogs are your number one hit, consider linking them to the different services on your website or writing more on that topic. Give the people what they want!
- See where people are coming from. If most of your clients are coming from Indianapolis, IN, consider doing a geo-targeted ad campaign on social media or Google for increasing the traffic with targeted regional keywords like Indianapolis, Carmel or Brownsburg.
- Check what channel people are using to get to your website. If organic search is low on the list, consider improving your search engine optimization or consulting an SEO expert for help. If traffic is coming in through your social channels, make sure it is optimized for mobile because most people visit Facebook and Twitter through apps on their phones. Continue pushing out content through those channels and consider combining the location data with the social channel data for targeted campaigns!
- Identify your worst performing pages and work to improve them. If it’s a blog post, don’t worry if it didn’t perform as well; it’s still relevant content to your industry, it’s just not a topic people are interested in reading about. In the future, work to improve new posts by sticking to topics that perform well and try to steer clear of topics that don’t. If the worst pages are key pages in your site, however, make sure you improve the content, the keywords and better convey your company’s message through projects, images, and other relevant information.
Google Analytics can be incredibly overwhelming at first glance, but with these simple steps, you can uncover key information about your website’s performance, areas for improvement, and marketing strategy. As you grow from these steps, you can dive deeper into the data by just clicking around on the left navigation to see the technology used, visitor’s gender, conversions rates and much more! Don’t ignore what the data is telling you and make sure to improve, improve, improve! High performance drives traffic which drives leads, conversions and sales.
If you would like more information about Google Analytics we are here to help! Contact Us Today!